A power meter tells you how much power and energy a circuit used. A power quality analyzer also records how good that power was, event by event. The meter answers the energy and cost question. The analyzer answers the question of why a machine tripped.
Many plants need both answers. The useful news is that one instrument can now give both.
What a power meter records
A power meter measures voltage, current, power, power factor and energy on a circuit. It adds energy up over time in kWh. It also records demand, the average power in each billing interval.
A plant uses that data to split energy cost by line or by department, to track demand, and to check the utility's numbers.
The key number on a power meter is its accuracy class. The S in Class 0.2S means the meter holds its accuracy down to low load, where a plain 0.2 meter is allowed to drift.
What a power quality analyzer adds
A power quality analyzer does everything a meter does. It also watches the shape and steadiness of the supply and records what goes wrong.
- Sags, swells and interruptions. Each one is logged with its time and its depth.
- Waveforms. The analyzer captures the actual voltage and current waveform around an event.
- Harmonics. It measures the distortion that drives and other electronic loads put on the supply.
- Unbalance. It records uneven voltage and current between phases, which shows up as heat in motor windings.
The key number on an analyzer is its class under IEC 61000-4-30, the standard for how power quality is measured. Class A is the top class. The standard has editions, so "Class A" alone is not a complete specification. Ask which edition.
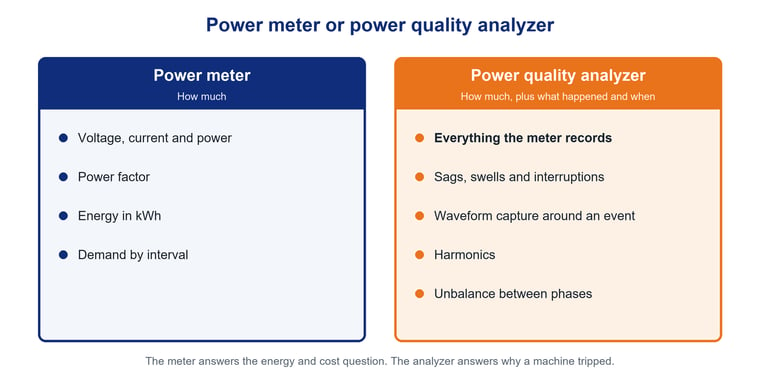
A meter records how much. An analyzer also records what happened and when.
Which one answers your question
| The question | What answers it |
|---|---|
| How much energy does each line use? | A power meter on each feeder, or one multi-circuit meter on the panel |
| What set last month's demand charge? | A meter on the service that logs demand by interval |
| Why did the machine trip at shift change? | An analyzer that logs sags and captures the waveform |
| Why does this drive keep failing? | An analyzer that measures harmonics and their direction |
| Why do the motors on this feeder run hot? | An analyzer that records voltage and current unbalance |
One instrument that does both
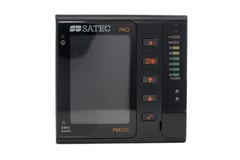 The line between the two has moved. The SATEC PRO Series is three instruments in one: a Class 0.2S meter, a Class A Edition 3.1 power quality analyzer, and a setpoint controller. A panel schedule carries one device where it used to carry three.
On the PRO Series, waveform capture is selectable up to 256 samples per cycle. A measured event is plotted against the ITI curve, which shows whether the event was really out of tolerance.
On a drive that keeps failing, the PM335 and EM235 measure harmonics to the 63rd with their direction. That shows which side of the drive the harmonics come from.
When a plain meter is enough
Where the question is energy by circuit, a multi-circuit meter is the simpler tool. One SATEC BFM-II meters up to 54 single-phase or 18 three-phase circuits from a single DIN rail unit. It reports over Modbus or BACnet to the system the plant already runs.
Standard SATEC meters can also catch sags, swells and interruptions through their setpoints. A smaller plant with a trip problem can see what the supply did before the trip without buying an analyzer.
Getting the data out
A meter that nobody reads solves nothing. Two paths get the data in front of people.
- Into the plant's own system. The meters report over Modbus, so a PLC, a SCADA system or a historian can poll them.
- Into reports. SATEC's PAS power analysis software ships with every instrument at no charge. It handles configuration and automatic power quality reports.
What drives the cost
- Meter or analyzer. Event capture and waveform recording cost more than energy measurement alone.
- Circuit count. One instrument on the service is one device. Breaking out loads adds circuits and sensors.
- Current sensors. Each circuit needs sensors sized to its conductor, and the sensor sets the accuracy of the whole measurement.
- Installation. A qualified electrician installs the sensors with the circuit de-energized, in a short planned window.
How it is bought and who supports it here
Dynamic is the SATEC rep for Northern California and Northern Nevada. Tell us the question you are trying to answer and send the one-line diagram. We will work out with you and with SATEC whether it takes a meter, an analyzer or one of each.
For the demand charge question on its own, see how to find which machines drive your plant demand charge. The SATEC page has the full range.
At Dynamic we represent power, control and measurement lines for machine builders, panel shops and plants in Northern California and Northern Nevada, and we are SATEC's rep across the territory.