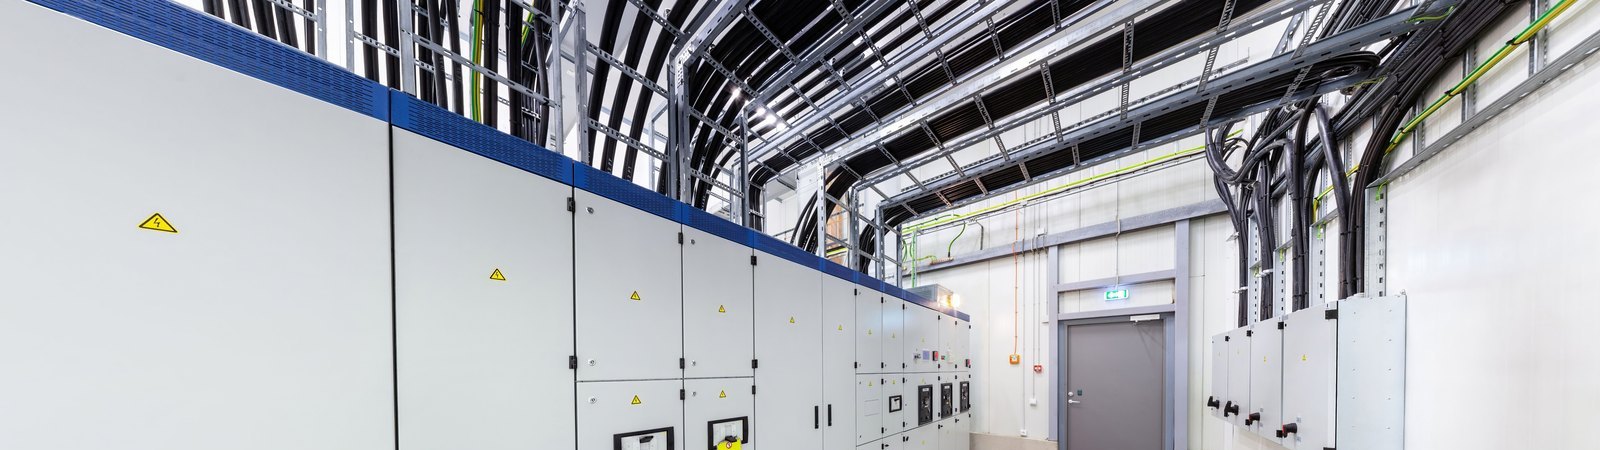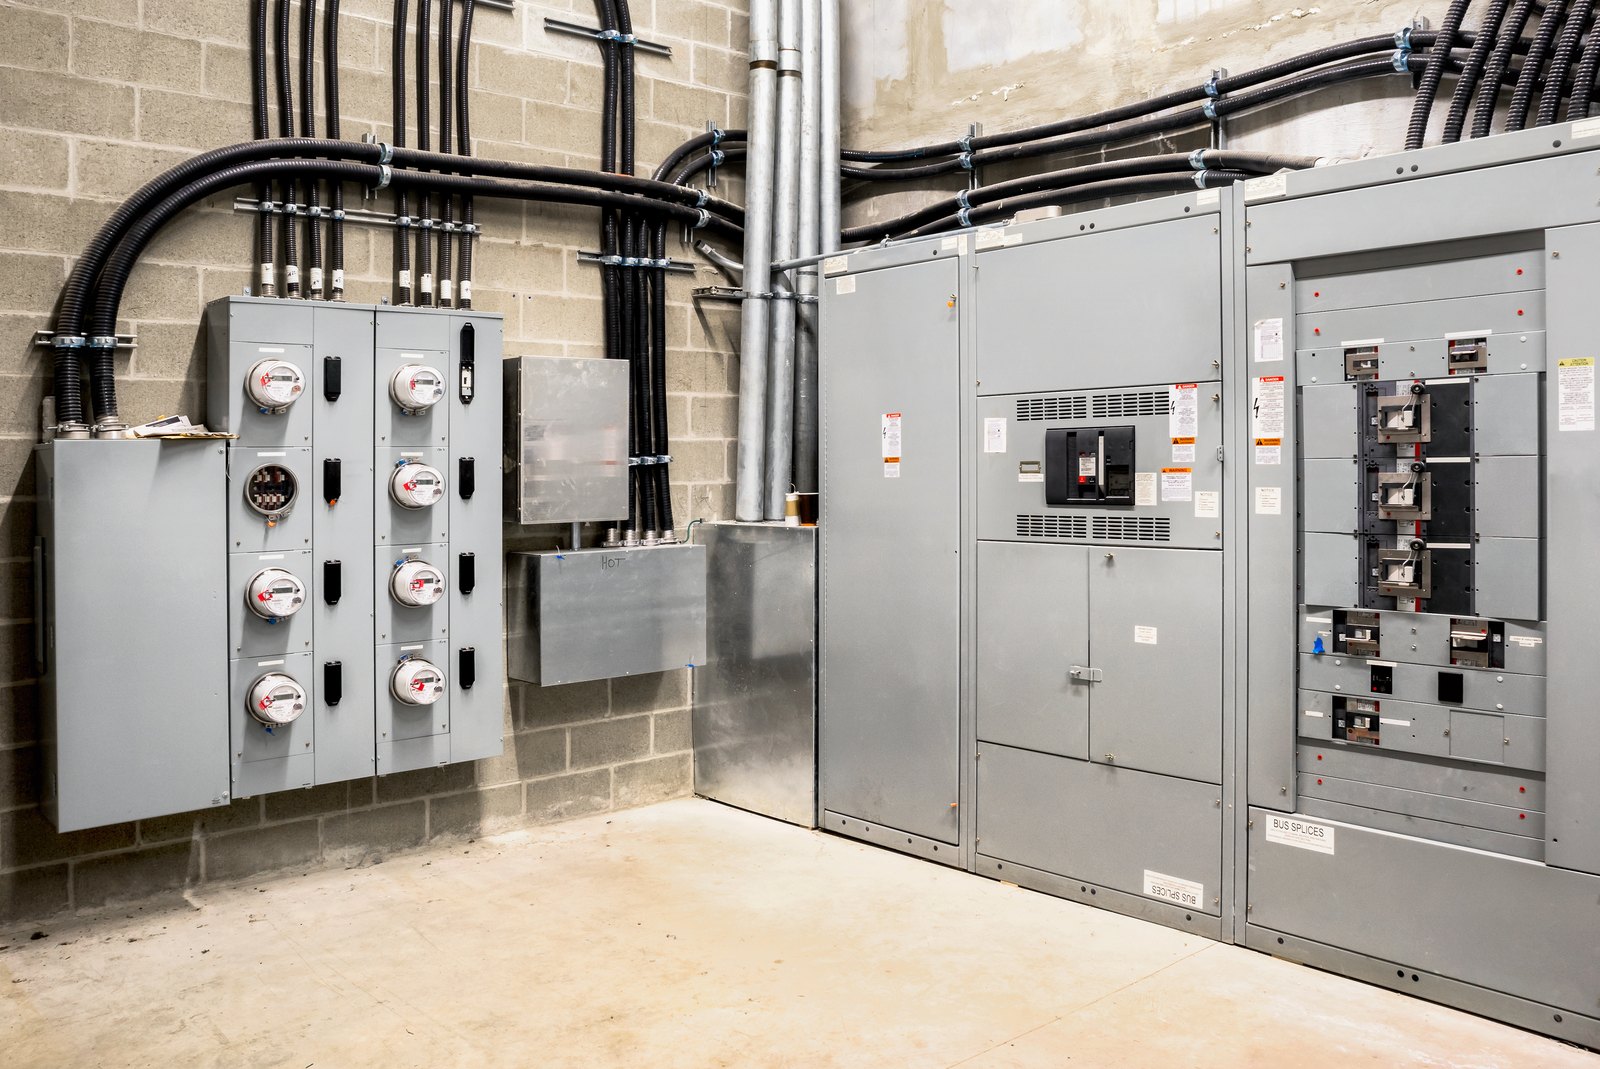
To find out which machines drive your plant's demand charge, you need two records. The first is a meter on the service that records demand the way the utility bills it, by interval. The second is energy by machine or by line. Put the two side by side and the interval that set the peak shows which loads were running.
Most plants have neither record. They have a monthly bill with one demand number on it and a guess about where it came from.
How a demand charge is set
A utility bills energy in kWh and demand in kW. Demand is the highest average power the plant drew in any one billing interval during the month. The interval is short, commonly 15 minutes.
That means one bad interval sets the charge for the whole month. Two large loads that start together once can do it. The plant can run well for the other 29 days and still pay for that one overlap.
The bill does not say when the peak happened or what was running. That is the missing information.
Step 1: record demand at the service the way the tariff bills it
 A power meter on the incoming service records demand in the same intervals the utility uses. It also keeps a time stamped log.
A SATEC PM17x PRO on the service records demand the way the tariff bills it and stamps every event to 1 microsecond. So the start that landed on the peak is a line in a log. It is no longer an argument between shifts.
Step 2: meter the large loads separately
 The service meter tells you when. It does not tell you which machine. For that, each large load needs its own measurement.
Ovens, chillers, compressed air and each production line get their own kWh. One SATEC BFM-II meters up to 54 single-phase or 18 three-phase circuits from a single DIN rail unit, so a whole panelboard is covered without a wall of meters.
Step 3: line the two records up
Find the interval that set the month's peak in the service meter log. Then look at what each metered load drew in that same interval.
The answer is often a short list: a few loads running together in one interval.
What tends to show up
- Overlapping starts. Two large loads start in the same interval at shift change or after a break.
- A recovery load. An oven, a chiller or a compressor catches up after a stop and runs at full power alongside production.
- A load nobody scheduled. A test, a cleaning cycle or a charger bank lands on the busiest part of the day.
Each one is a scheduling question once it has a time stamp on it.
What drives the cost of the metering
- How many loads you break out. The service meter is one device. The circuit count sets the rest.
- The current sensors. Each metered circuit needs sensors sized to its conductor.
- Installation. A qualified electrician installs the sensors with the circuit de-energized, in a short planned window.
- Where the data goes. SATEC's PAS power analysis software ships with every instrument at no charge. Feeding a plant system over Modbus takes configuration at that end.
Questions to settle first
- What demand interval does your tariff use?
- Which five loads are the largest in the plant?
- Is there a spare space in the panel for a DIN rail meter?
- Who reads the log each month, and who can change a start time?
How it is bought and who supports it here
Dynamic is the SATEC rep for Northern California and Northern Nevada. Bring us the one-line diagram and a recent bill. We will work out the meter list with you and with SATEC.
The SATEC page has the full range of meters and analyzers.
At Dynamic we represent power, control and measurement lines for machine builders, panel shops and plants in Northern California and Northern Nevada, and we are SATEC's rep across the territory.